Awards & Nominations
BredvID has received the following awards and nominations. Way to go!
Global Nominee

BredvID has received the following awards and nominations. Way to go!
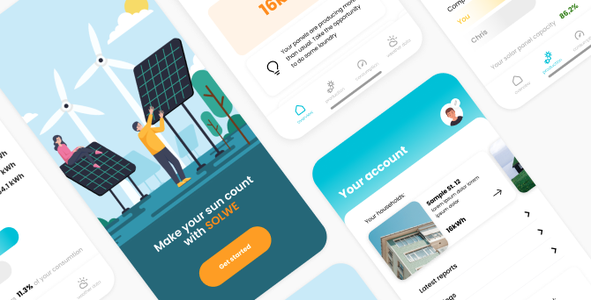
What if there was an easy way to motivate more people into investing in solar? What kind of impact could that make on solar power and even the environment?The application "Solwe" makes monitoring your solar panels easy and fun. The solution focuses on the user’s direct needs and demands. With help of data from NASA POWER, the user can predict, compare and plan their daily power consumption and production. Solwe will make even the least tech-interested person want to invest in solar.
THE PROBLEM
There is a lot of data available but not on a user-friendly mobile application. For civilians, it can be difficult to read and interpret.
There are no applications on the market at present to compare data and be able to predict energy production and efficiency from solar cells to plan their daily life.
Overall problems that exist for people are with understanding different types of units and data from statistics about solar energy and weather.
THE SOLUTION AND ACHIEVEMENT
Our solution is “Solwe” - an application that simplifies the usage of worldwide renewable energy resources all together in one single application. Solwe will also provide the user with extra value by giving personalized advice and notifications that give off a feeling of AI. In all the visual representations the user has the freedom to change all the parameters and add data like e.g. rain to compare with. Solwe combines NASA’s data with functions that let the users predict, compare, and plan their daily power consumption in a fun and user-friendly way.

The “Solwe” application has enabled the achievements:
LINK TO PROTOTYPE
LINK TO CODE
The data that we collected were mostly from NASA but other actors that are tracking data about solar cells were also investigated.
The NASA POWER Web Portal had a big impact on the project because our application holds many of the parameters that the portal provides. Also, the portals API has benefited us to develop a prototype of the application.
INSPIRATION FOR SELECTING THIS PROJECT
We are a team of interaction design students from Umeå University, Sweden. We chose this challenge because we wanted to motivate people to install solar cells and because we wanted to make a fun and simple app that uses and presents NASA's data in a user-friendly way.
APPROACH TO ACHIEVE A RESULT
During the project, we have used the design process and worked iteratively to create as user-friendly a platform as possible. We started by gathering information about the case, the target group, and also created a problem specification.
We created a survey and sent it out to users of solar cells in Sweden but also to those who do not use solar cells. The results were almost as expected and the participants also came with interesting angles of different approaches. While we waited for a response to the survey, we took the opportunity to compare which mobile applications that are currently on the market.
After gathering data from the web and the users we compiled everything in a requirement specification. The requirements we compiled were a combination of the specification for the challenge and what the surveyed users inquired in the application.

(Requirements specification)
Then we determined the structure and content of the application by going through the requirements specification. Then it was time to create lo-fi and hi-fi prototypes for the application and adapt to the different types of use cases. An overview of the application is shown below.

(Flowchart of the application)
API
We divided up as a group and while the design for the app was under development, we also started to code the application by using the API from NASA POWER. The demo application is developed in Swift and adapted for iPhone. But a similar implementation could be adapted to other types of mobile devices with more time.
SECURITY
If the application were out on the market it would be available to the public but the users have to accept permissions. Location permission is important to accept by the user for the best experience and precision. Notification permission will also pop up to improve user’s control of their solar cells. The last for the users to accept is photo permission, it is only for the profile features to make the application more personal. To ensure the user's security about their data we would use a secure online distribution.

(Security and permission)
PROBLEMS FACED
Problems that arose during the project are that we quickly realized that we do not have enough knowledge about how solar cells work. We also lack general knowledge about energy. But this problem was solved by reading about solar cells and energy.
Another problem that we faced was the difficulties to gather all the information, parameters, and settings from NASA’s POWER into our application and adjust to the user’s requirements. This problem was a major problem because we did not want the application to be messy and not easy to use. In the end, we solved this problem because of the iterative design we worked with during the prototype development.
The last problem that we had was the time, especially with the code. We were not so experienced using API’s and it took a while to get the code working. With the code, it was also a challenge to implement security that takes care of the user permissions. With more time the implementations would have been more developed.
RESOURCES
JAXA Himawari Monitor (P-Tree System)
https://www.eorc.jaxa.jp/ptree/index.html
NASA POWER | Prediction Of World Energy Resources
Greenly
MySolarEdge
https://www.solaredge.com/swe/mysolaredge
NASA, clean energy
https://www.nasa.gov/centers/ames/greenspace/clean-energy.html
SolarReviews, Peak Sun Hours: Explanation and Numbers By State
https://www.solarreviews.com/blog/peak-sun-hours-explained
Solar, Department of Energy
Axion Power, Power world with solar
https://www.axionpower.com/knowledge/power-world-with-solar/
TOOLS
CODING LANGUAGES
#NASA #solar #app #savetheworld #greenpower
This project has been submitted for consideration during the Judging process.