
High-Level Project Summary
Sea level rising is one of the danger that came with global warming. This project meant to show how water rise on a simulated earth based on data of the past, illustrate how the global CO2 emission correlate to a change in sea level and warn people about the risk tha we are facing
Link to Project "Demo"
Link to Final Project
Detailed Project Description
Tool used: Blender 2.8 for modelling
Vanilla Webpage + Three js to load model
Python numpy for data proccesing
What does it do:
It is a webpage showing how CO2 emission would effect the sea level on a simulated earth environment, listing different CO2 level over the years emitted globally for reference and how the risk would looks like in the near future.
How does it work:
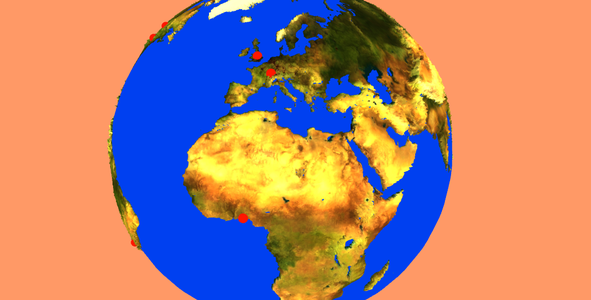
Run the npm run dev in specific folder, where a model which was modeled in blender by applying a exagerated height map will loaded up on the front end, along with a sphere ontop to demonstrate the water. The user will have control over the CO2 emission, an equation derived from the data will be determine how much the water on the model would be rising, Along with that, the web will notify the user when some chosen location will be submerged underwater, showing the effect of sea level rising.
Benefit:
Showing a visual representation on the effect of CO2 emission.
Hope to achieve:
A more memoriable image of how the effect of global warming in the long run would looks like to demonstrate it's risk. Achieving a more simplistic design that show less data in terms of number and rather to visualized them to fit the eye of average people.
Space Agency Data
These data will also be linked in the website:
Earth Height map: https://visibleearth.nasa.gov/images/73934/topography
Use: I applied the height map on a plane and wrap it to make a sphere in blender, changing the strenght of the model would change how the height map would scaled up.
Our world data, CO2 emission: https://ourworldindata.org/co2-emissions
Nasa: GSML (I needed to create an account to login into here) : https://podaac-tools.jpl.nasa.gov/drive/files/allData/merged_alt/L2/TP_J1_OSTM/global_mean_sea_level/GMSL_TPJAOS_5.0_199209_202106.txt
Use for the last two is to combine them together create a model to predict how the sea level would rise based any the CO2 emission, basically a second degree line of best with parameter determined by least mean squared.
Hackathon Journey
This project was very eye opening, I was always wanted to contribute to the global community in some way and I knew that I wanted to do so via coding and my prior experience, however I lacked the neccesary resources and push, or maybe I needed a narrowed down goal. And thats what Nasa hackathon provided to me, a narrowed down goal that give me the right push to create something that have meaning for the global community. I chose this challenge is because it is the most familiar and the most scary to me, the fact that our invention or now beyond saving and we are heading into a much less comfortable future. My approach to the challenge was to first ideate on what I can do, I wanted something more visual than just showing just plot and chart, and so after many idea I came up with the idea of a 3d earth being filled up with water. By creating MeltingEarth, I learned alot about 3d modelling and how to make a website with an interactive 3d environment.
References
Earth Height map: https://visibleearth.nasa.gov/images/73934/topography
Our world data, CO2 emission: https://ourworldindata.org/co2-emissions
Nasa: GSML (I needed to create an account to login into here) : https://podaac-tools.jpl.nasa.gov/drive/files/allData/merged_alt/L2/TP_J1_OSTM/global_mean_sea_level/GMSL_TPJAOS_5.0_199209_202106.txt
Stack overflows: https://blender.stackexchange.com/questions/24043/how-to-animate-morphing-a-rectangular-plane-into-a-sphere/24053#24053
Tags
#earth #globalwarming #website #water #sealevel
Global Judging
This project has been submitted for consideration during the Judging process.