Awards & Nominations
Make it Cool has received the following awards and nominations. Way to go!


Make it Cool has received the following awards and nominations. Way to go!
Global warming is an increase in the Earth's average temperature caused by greenhouse gas emissions. If nothing changes, the future of our planet is in great danger. But what future do we want? Can we make the difference? We have the data and people willing to help, but we need to make accessible information. Using earth observations and statistics we can predict future effects of global warming and provide guidance on mitigation. By making this type of information available, we make it possible to be conscious in the present and that’s what leads to real changes! As humans, union is our strength, and we can unite global communities towards a single goal: saving our planet.
Global warming is increasingly presenting environmental impacts and risks to human health. Forest fires, droughts, melting ice caps and rising sea levels are just a few impacts. We know that many people want to do something to change the world. However, the lack of information available in a simple and accessible way makes it difficult to take actions that can really change something.
Based on this, “make it cool” aims to use historical data and statistical models to make predictions about the future impacts of global warming, such as the increase in temperature and carbon dioxide emissions. There are several databases and information, but presenting these data in a way that everyone can understand is extremely challenging. It is really important to present information about the current situation of global warming, models to predict future impacts and make people aware of how they can make a difference. When presented simply and accessible to anyone, it is possible to create a level of awareness that enables real change.
We know that the strengths of communities is what makes us stronger. We want to create a sense of community where people from all over the world can come together, share their ideas and see what other people are doing to change the world. Each individual action may seem to have little effect, but when we come together for a common goal, we can change the future. By bringing communities together based on awareness, accessible information and science, imagine how many things we could change.
Aiming at this, in addition to simplifying and making available models for forecasting the future and current data, we also seek to make people aware of how each of their actions affect the environment. Comprehensive information about means of transport, conscientious consumption, use of water and energy and waste disposal guides people on how they can make a difference individually. It is also possible to observe information about government measures that guide people on how our governments can do something for a better world.
Learning about global warming in a simple, accessible and interactive way is one of the best ways to learn about its causes, effects and mitigation measures. You can even learn more about the topic by playing. “Make it cool: The Game” is an intuitive game where each of your choices and actions can change the future, just like in the real world.
To be able to predict the evolution of global warming in the future, it's crucial to understand possible impacts and allow measurements in the present using data from surface observations. We used for this analysis data about CO2 emissions and temperature variations of the last decade until now, to project predictions about the evolution of CO2 in the atmosphere and about future temperature variations in a given coordinate, which can later be used to create alerts. A time series forecasting prediction for the city of São Paulo can also be observed. The prediction model was based on fpp2, ttr and dplyr libraries and allowed the creation of predictions by Forecast, developed in R. It was verified by plotting the graphs below, that the temperature data are seasonal, so it is necessary to process the data. In CO2 emissions was not observed seasonal variability of the data, thus was not necessary to apply seasonal correction.
Figure 1: Residuals from seasonal naive method, obtaining standard deviation sd = 3.2153.
Figure 2: Residuals from ARIMA method, standard deviation obtainig sd = 2.673574
Figure 3: Residuals from ETs, standard deviation obtainig sd = 3.2153.
Figure 4: Final forecasts, using ETS method.
Figure 5: CO2 forecasts.
There are many different thermal stress indices have been developed to assess heat stress on the human body. The Wet-Bulb Globe Temperature (WBGT) is one of the most popular. It combines the temperature, relative humidity, wind speed and solar radiation values. Other factors such as dressing, seasoned and metabolic activity, are used as a parameter.
The equation used to calculate the maximum WBGT for human exposure in outdoor environments is:
WBGT=0.7Tw+0.2Tg+0.1Ta
Where: Tw consists in the natural wet bulb temperature of the wet bulb, Tg is the temperature of the black globe and Ta is the air temperature.
In the scientific literature, it is possible to find the use of data from model simulations climate scenarios for the projection future maximum WBGT. A database containing these ones is the Eta-HadGEM2-ES Regionalized Climatic Model provided by the Brazilian Space Research Institute (INPE). Based on data from NASA and forecasts made, we obtained data of the same nature as those from the INPE database.
Making statistical predictions for the other climate parameters present in the index (data present in the same NASA database), we can calculate the WBGT using HeatStress Package in program R (https://rdrr.io/github/anacv/HeatStress/src /R/wbgt.Liljegren.R).
The most common reference values for heat stress levels are established by the Sports Medicine and Physical Fitness Committee of the American Academy of Pediatrics (2000). These are expressed in the table below.

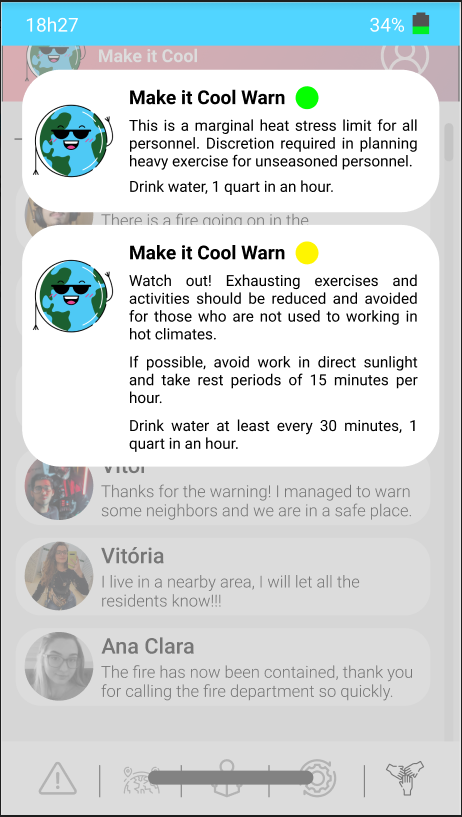
The WBGT can be calculated for days, weeks or months in the future. Values generated as output for a particular location and date are going to be associated with levels and flags and, thus, sent as a notification for the user of the app or whoever looks for the information on the website.
The notifications contain color information corresponding to the flags and guidelines on how to act, such as seeking a safe shelter without direct exposure to the sun, recommendations on water consumption etc.
 ur site was created with the intent of reuniting useful information, impacts visualization, guide for individual actions, a game to have fun while learning and a community space!
The website was divided into 6 pages:
- Home: a place where you can see all our main information.
- About Us: This is Make it Cool is a section where you can meet our team, learn about our history, projects and goals
- Map: We made a heat map with wildfires, water color, temperature extremes,dust and Haze, Drouht
- Learn: Find climate change mitigation divided into individual and state and national actions
- Game: Learn by playing, we have developed a game so you can test your impact on the globe.
- To inspire: Post a picture of yourself doing things learned on the website that help saving our planet using #makeitcool. Your photos will be shared with our community where you can also see what other people are doing for a better future. Together we can make it cool!
Have fun while learning about how your choices impact the future of our planet! More information about how to play and the objectives in the site below the game.

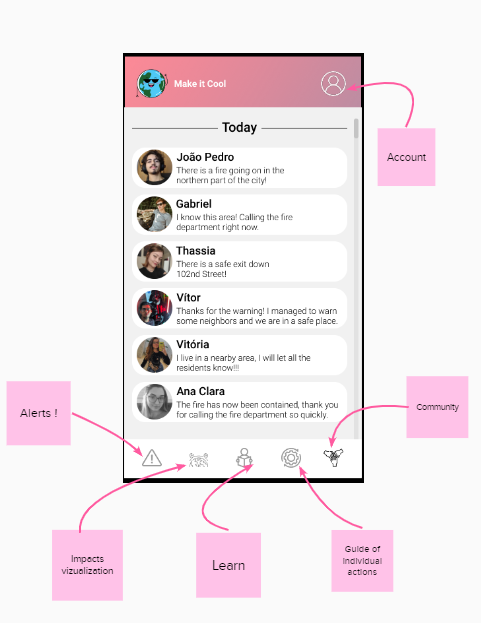
Mobile apps are very common in our daily lives, thinking about the popularity of this application we develop a prototype to make easier to accesses information about climate change. On the prototype, we have several features:
GITHUB: https://github.com/MrVtR/Make_It_Cool_NASA_Space_Apps_2021
Using The POWER project, supported by NASA Earth Science’s Applied Sciences Program, we downloaded data about temperatures in São Paulo - Brazil. This data was used to forecast temperatures. Available in: https://power.larc.nasa.gov
Trends in Atmospheric Carbon Dioxide used to forecast CO2 in the atmosphere, provided by Global Monitoring Laboratory. The data is a daily, so we converted it in monthly mean. Available in: https://gml.noaa.gov/ccgg/trends/gl_data.html
The map on our site was made using NASA Open APIs, specifically EONET - The Earth Observatory Natural Event Tracker. The observations used was wildfires, water color, temperature extremes, dust and haze, drought, man-made, severe storms and floods. Available in: https://api.nasa.gov
Our world is undergoing severe environmental and social changes. Every day we can see different impacts of climate change. Even while this challenge hapens, members of our group are experiencing direct results of global warming, such as water shortage. As young students and conscientious citizens, we are not content to sit still. We want to be agents of our own destiny and act today for a better future. However, the lack of information available in a simple and accessible way makes it very difficult for each person to do their part. We want to show that through awareness, information and science, people around the globe can come together to change the world. We have the conditions, we have the disposition, all we need is to act. Together we learned a lot of new things. We learned new ways to program, new strategies, new visions and, above all, we made great friendships. The path is not simple, but this is a fight we can win together. We would still like to make a special mention to the mentors of this challenge who helped us so much with their challenging questions and constructive criticism, inspiring us to be even better.
NASA AND ITS PARTNERS' RESOURCES
NASA Earth Observatory Natural Event Tracker. (2021, October). API data Retrieved from https://eonet.sci.gsfc.nasa.gov
NASA. (2015) Climate Change and Cities. Retrieved from https://pubs.giss.nasa.gov/docs/2015/2015_Rosenzweig_ro02510w.pdf
NASA Global Climate change. (2021) Carbon Dioxide. Retrieved from https://climate.nasa.gov/vital-signs/carbon-dioxide/
NASA The Power Project. (2021) Multiple Data Access Options. Retrieved from NASA POWER | Prediction Of Worldwide Energy Resources
EXTERNAL RESOURCES
US Navy. (2021) Heat Stress. Retrieved from https://www.cnic.navy.mil/regions/cnrsw/installations/naf_el_centro/om/heat_stress.html
NOAA. 2020. Trends in Atmospheric Carbon Dioxide. Retrieved from Global Monitoring Laboratory - Carbon Cycle Greenhouse Gases (noaa.gov)
Canadian Centre for Occupational Health & Safety. (2021). Hot Environments - Control Measures. Retrieved from https://www.ccohs.ca/oshanswers/phys_agents/heat_control.html
Hyndman, R.J., & Athanasopoulos, G. (2018) Forecasting: principles and practice, 2nd edition, OTexts: Melbourne, Australia. Retrieved from https://otexts.com/fpp2/
CDC. Heat-Related Illness. Retrieved from https://www.cdc.gov/pictureofamerica/pdfs/picture_of_america_heat-related_illness.pdf
#GlobalWarming #ClimateChange #Recycling #MakeItCool
This project has been submitted for consideration during the Judging process.